
JARED BERNSTEIN HAS NO CLUE WHATSOEVER?
Jared Bernstein is the Chairman of the Council of Economic Advisers for President Joe Biden.
An interview was recently published on Twitter/X. It shows Jared Bernstein unable to clearly explain how the US Government finances itself. He dithers and stumbles forward.
BOOM was shocked, shocked by the lack of knowledge, the confusion, the inability to explain US Government finances.
Watch the short video carefully and form your own conclusions. Then come back to BOOM and read on.
and also here ……
As well as being President Joe Biden’s chief economic advisor, Bernstein is also a senior fellow at the Center on Budget and Policy Priorities.From 2009 to 2011, Bernstein was the chief economist and economic adviser to Joe Biden when he was Vice President in the Obama Administration.
He is an ex-Jazz musician, graduated with a bachelor’s degree in music from the Manhattan School of Music where he studied double bass. He also earned a Master of Social Work from Hunter College as well as a DSW in social welfare from Columbia University’s school of social work.
However, somehow, in 1992, Bernstein started working as a senior official at the Economic Policy Institute (EPI), a liberal think tank with a focus on issues affecting low- and middle-income working people.And, somehow, from 1995 to 1996, he served in the United States Department of Labor as deputy chief economist. He then returned to the EPI, as senior economist and director of the Living Standards Program.
Bernstein sits on the Congressional Budget Office’s advisory committee and he is a contributor at the financial news network CNBC.
It all sounds like the stellar career of an economics expert. Until this was published on Twitter/X. Fortunately, it will not be censored.

QUOTE from the Twitter Post: “Biden economic advisor Jared Bernstein turns into bumbling mess after he’s asked why the government borrows money if they can just keep printing it. We are so screwed.”
Question: “They print the dollar. So why does the government even borrow?
Bernstein: “Well, so the, I mean again, some of this stuff gets some of the language that the mmm, some of the language and concepts are just confusing. … The government definitely prints money and then it lends that money by, by selling bonds. Is that what they do? They, they, they, yeah, they, they, they sell bonds. … So, yeah, I, I, I guess I’m just, I don’t, I can’t really talk. I don’t, I don’t get it. I don’t know what they’re talking about.”
BOOM TO THE RESCUE — THIS IS HOW IT WORKS, JARED.
THE FED DOES NOT “PRINT MONEY”
BOOM can offer some help and clarity to Jared (if he cares enough to learn) and others —
The Federal Reserve is America’s central bank. Its job is to manage the US money supply, 98 % of which is digital at origin and begins life on electronic banking ledgers. That credit money is (mostly) created by commercial banks whenever they extend a new loan to a willing borrower. The loan is denominated in the nation’s currency. Physical cash when issued by the US Treasury makes up is the remaining 2 % of money supply at origination.
Many people say the Fed “prints money.” But the Fed doesn’t have a printing press that cranks out physical currency. Only the US Department of Treasury can do that.
The Bureau of Engraving and Printing (BEP) is a government agency within the United States Department of the Treasury. It designs and manufactures U.S. physical currency (cash) and securities (Treasury Notes, Bills, Bonds and TIPS). One of its major goals is to prevent counterfeiting. The currency’s design also conveys dignity, the power of the U.S. economy, and familiar markings that distinguish it as American. The BEP uses distinct designs, paper, and ink. It added subtle background colours to improve security in 2003.
The BEP at the Treasury prints physical dollars (currency/cash) – referred to as Federal Reserve Notes – each year for delivery to the Federal Reserve Banking System and distribution to the commercial banking system. The BEP also redeems Notes that are physically damaged or mutilated.
The Federal Reserve operates as the nation’s central bank and serves to ensure that adequate amounts of physical currency and coins are distributed and in circulation. It also (indirectly) manages the volumes of digital credit money that exist on commercial bank ledgers. It does that via the overnight official interest rate setting by the FOMC (the Federal Open Market Committee). Rarely (very rarely), the Fed engages in QE (Quantitative Easing) when it purchases Treasury Securities from the US Treasury or from the open market. It funds QE through the expansion of Banking Reserves within the banking system. The central bank can sell the assets purchased under a QE Program back into the open market whenever it wishes to do so. The US Government spends the proceeds of its Bond sales in QE into the economy to provide extra economic stimulus.
The BEP does not produce coins – all U.S. coinage is minted by the United States Mint. The US Mint is a bureau of the Department of the Treasury.
So — the US Government’s Treasury Department can (and does) print physical US Dollar notes (at the BEP) and also mints coins (at the US Mint).
When the government spends more than it receives in taxation revenues, it has a Budget Deficit. It finances the excess spending through the issuance of Treasury Securities (T Notes, T Bills and TBonds) to willing investors. These securities are contractual promises made by the US Government. Most nations do the same to finance their budget deficits. Remember, QE is a rare event and the volumes of money involved in QE are relatively small over time compared to the normal cumulative sales of Government securities that occur every year and compared to the cumulative amount of GDP over time.
That video of Bernstein bumbling is now public knowledge. There are many articles in the mainstream media critical of Bernstein’s performance. It cannot be censored.

JAPAN IS AN EYE OPENER — ECONOMIC AND FINANCIAL ASPECTS
BOOM recently visited Japan for 3 weeks. Japan was an eye-opener in many ways. BOOM last visited about 9 years ago.

The Japanese people are polite, calm, extremely well dressed, helpful, and aware of their responsibility to act civilly in a crowd. Greater Tokyo contains 37 Million residents. Yes, 37 MILLION. They are well educated, hard-working, consumerist, materialistic but very compliant. Their economy is delivering abundance in consumerist goods available for purchase. The stores are packed full of goods and all manner of high quality food is abundant. Almost every car is brand new. Unemployment is not an issue.
They live with the constant risk of death from earthquakes, volcanoes and Tsunami. Somehow, they contain their anxiety about that risk. They will manage it if and when it comes and many will (clearly) not survive. That reality of nature challenging their very existence is a constant threat that tends to have a sobering effect.
They are pragmatic, always ready to help. Everything is very efficient. It is almost the exact opposite of what their nation was prior to and during World War 2. Housing is functional and varies in quality considerably.
Good leadership in a monoculture is probably the key to understanding much of that. However, the Japanese understand that they live in a very uncertain and threatening natural environment. So they are willing to work cooperatively together as a team. But they know what happened in the past when compliance to poor leadership left their nation almost destroyed.
The total population peaked in 2009 at just above 128 Million. Since then it has declined to 122.5 Million. That is a 4.3 % contraction from the peak.
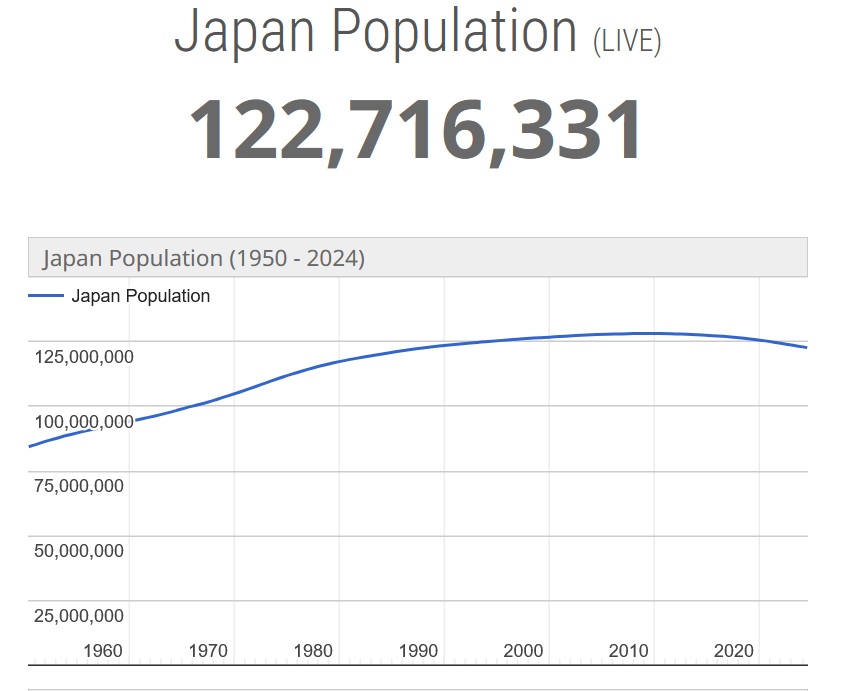
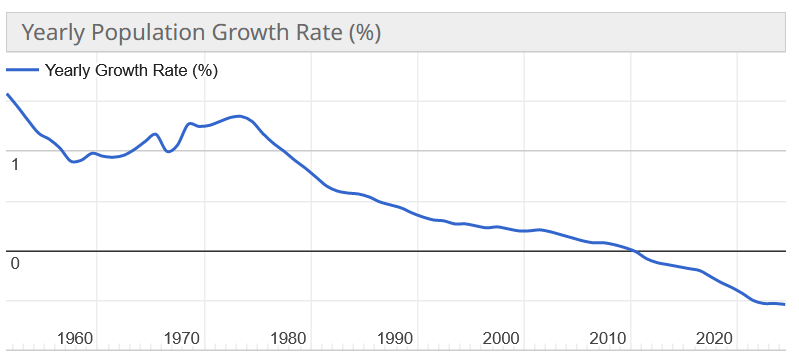
The current annual rate of decrease is – 0.54 %.
In 2023, the National Institute of Population and Social Security Research released a report —
Population Projections for Japan 2021 to 2070 (2023 revision)
Summary of Results
Japan’s population is projected to decrease by 30% by 2070, and the population aged 65 and over to then make up about 40% of the population. The percentage of the population aged 65 is currently just below 30% (in 2020). While the projected future total fertility rates are lower than those in the previous revision released in 2017, the pace of population decline should slow slightly due to an increase in life expectancy and a rise in net migration of non-Japanese nationals. Compared to the previous projections in 2017, the 2023 revision expects a further decline in fertility, a slight increase in life expectancy, and a rise in net migration.
Over the next 50 years, the total population is projected to decrease to nearly 70% of the current level (medium-fertility/medium-mortality scenario). This decrease will have significant economic impacts.
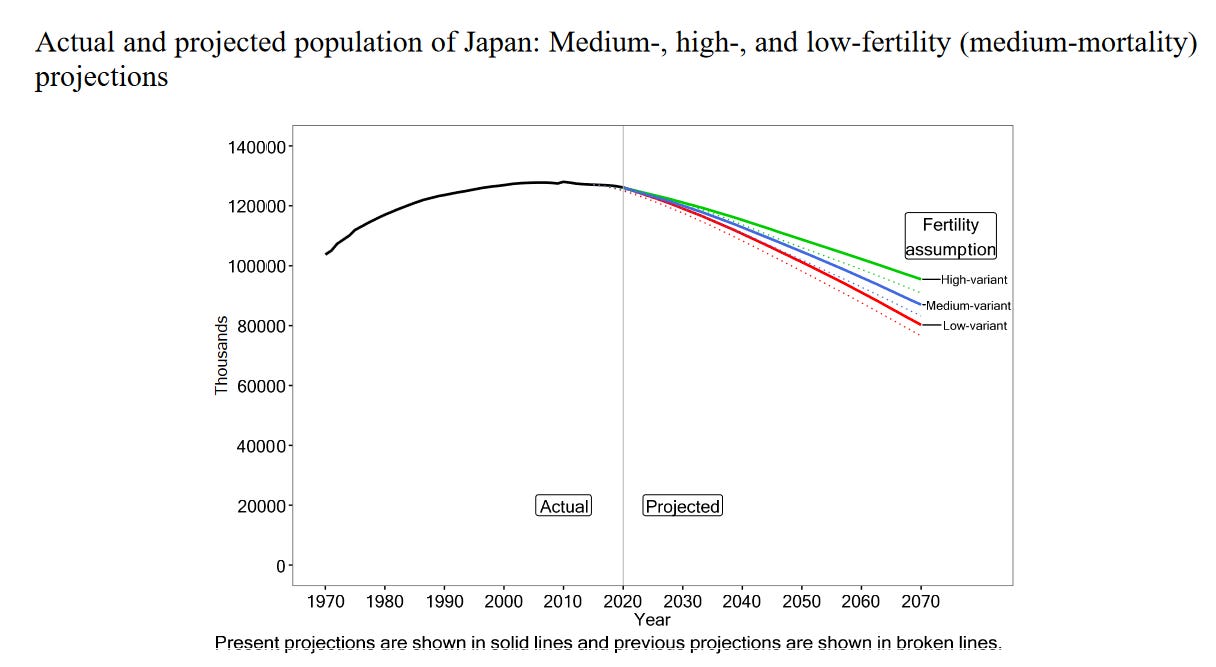
In the medium-fertility/medium-mortality scenario, the Japanese population in 2070 is projected to be 77.61 million. This is 60% of the Peak population recorded in 2009 of 128 Million.
Just from population decline alone, the Japanese economy should contract by 40 % in that time frame. However, if you factor in the increased age of the population over time, the economic contraction should approach 50 %.
No Western, advanced economy has ever experienced such a scenario. The Money Supply will inevitably fall in response to falling demand for bank credit. CPI dis-inflation (or deflation) and asset price deflation will be an inevitable and persistent reality. In other words, everything should either fall in price (deflation) or fall in the rate of increase in price (dis-inflation).
The economy is destined to contract. De-growth is the new paradigm. Low CPI inflation and low interest rates should become the norm. Unemployment should remain low.
The Japanese government has reformed immigration policy to encourage more migrant workers in recent years. However, there are a lot of other nations competing for those migrants. So any increased population numbers from migration will be marginal over time and therefore not significant in economic terms.
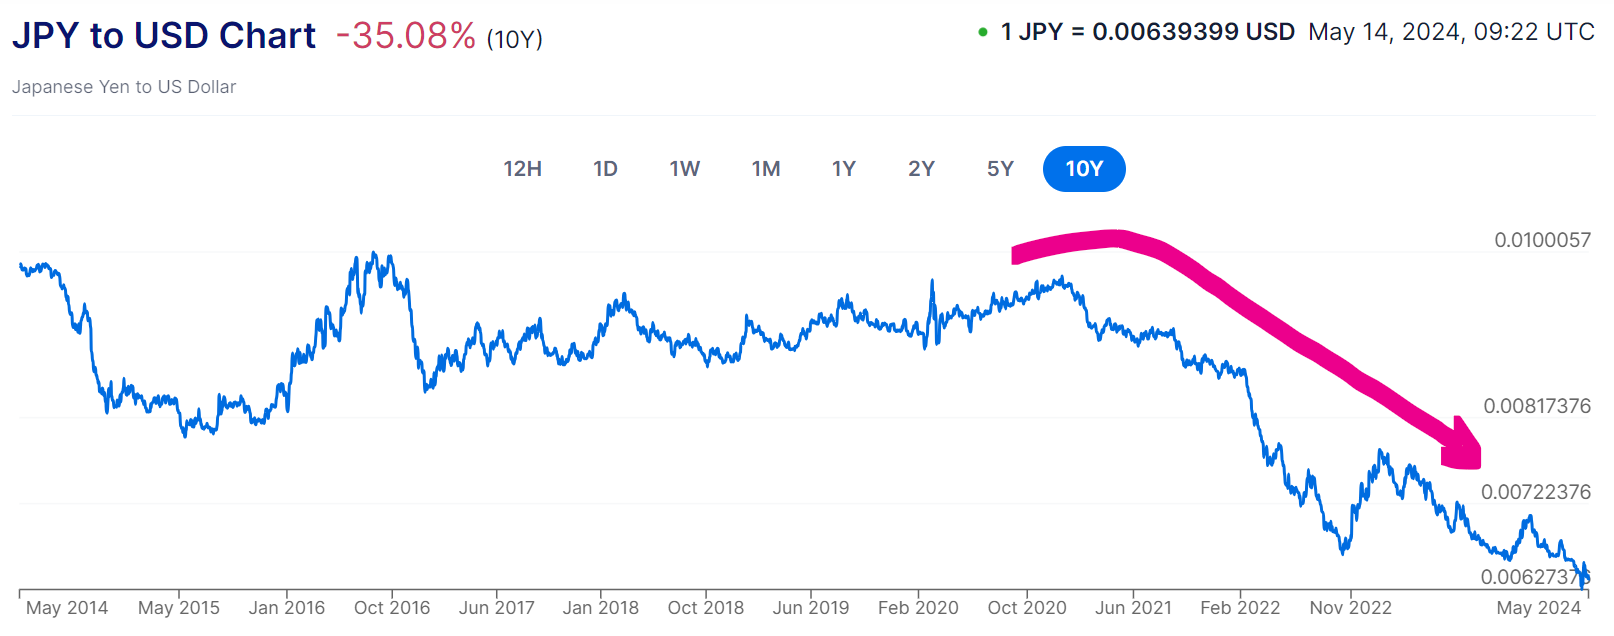
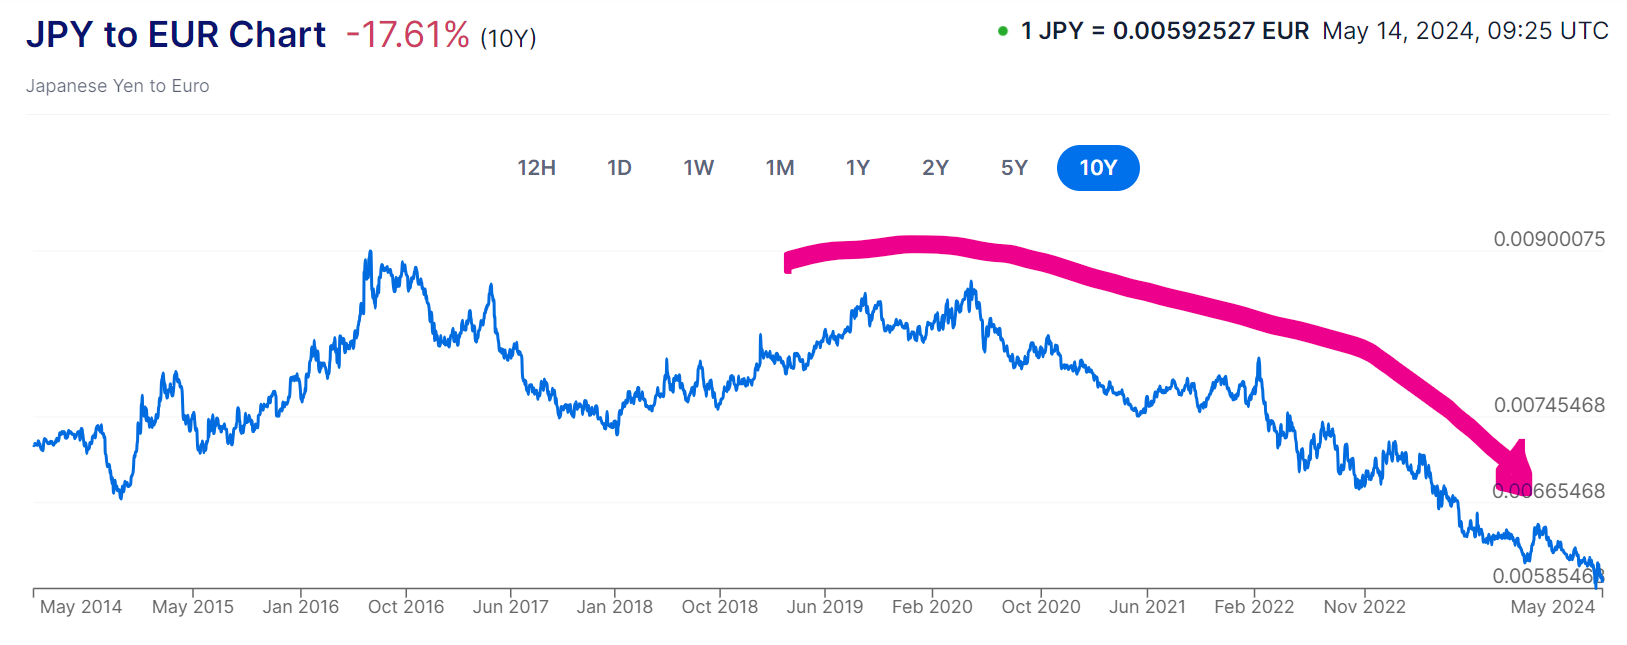
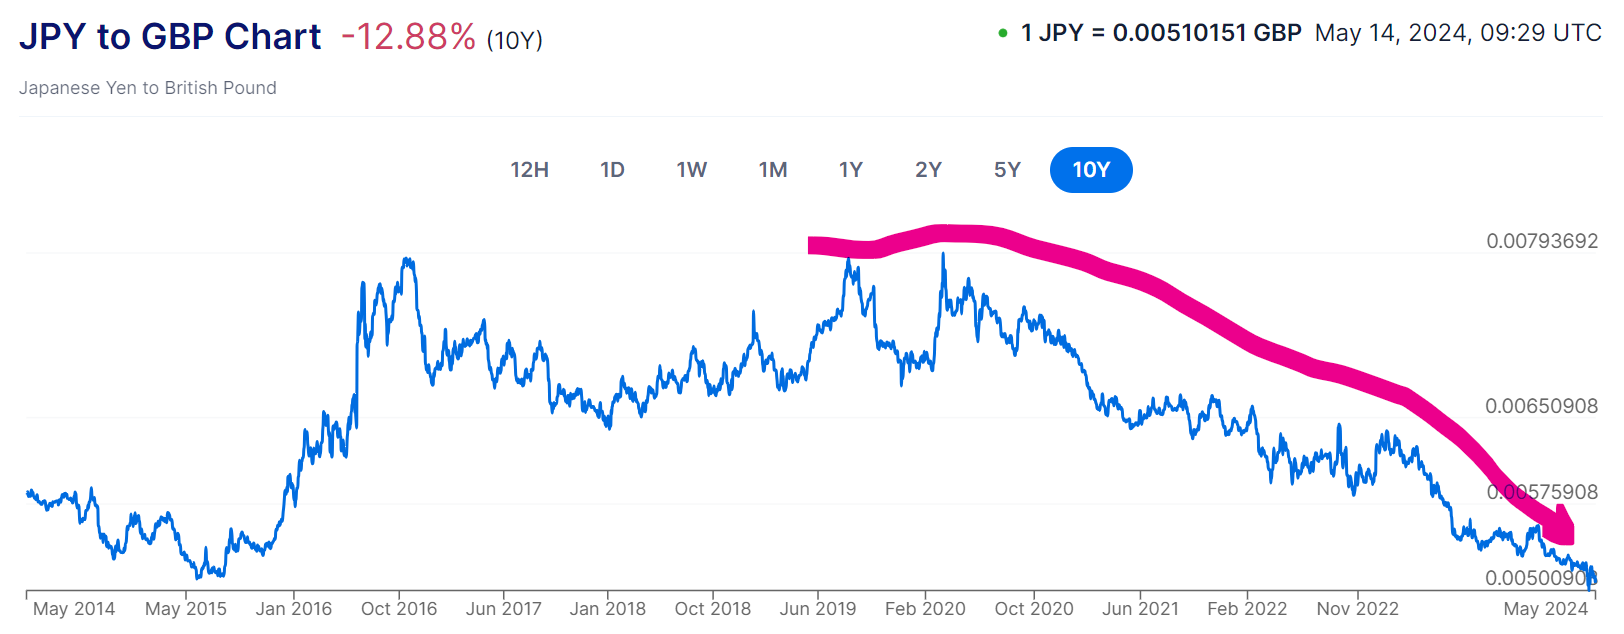
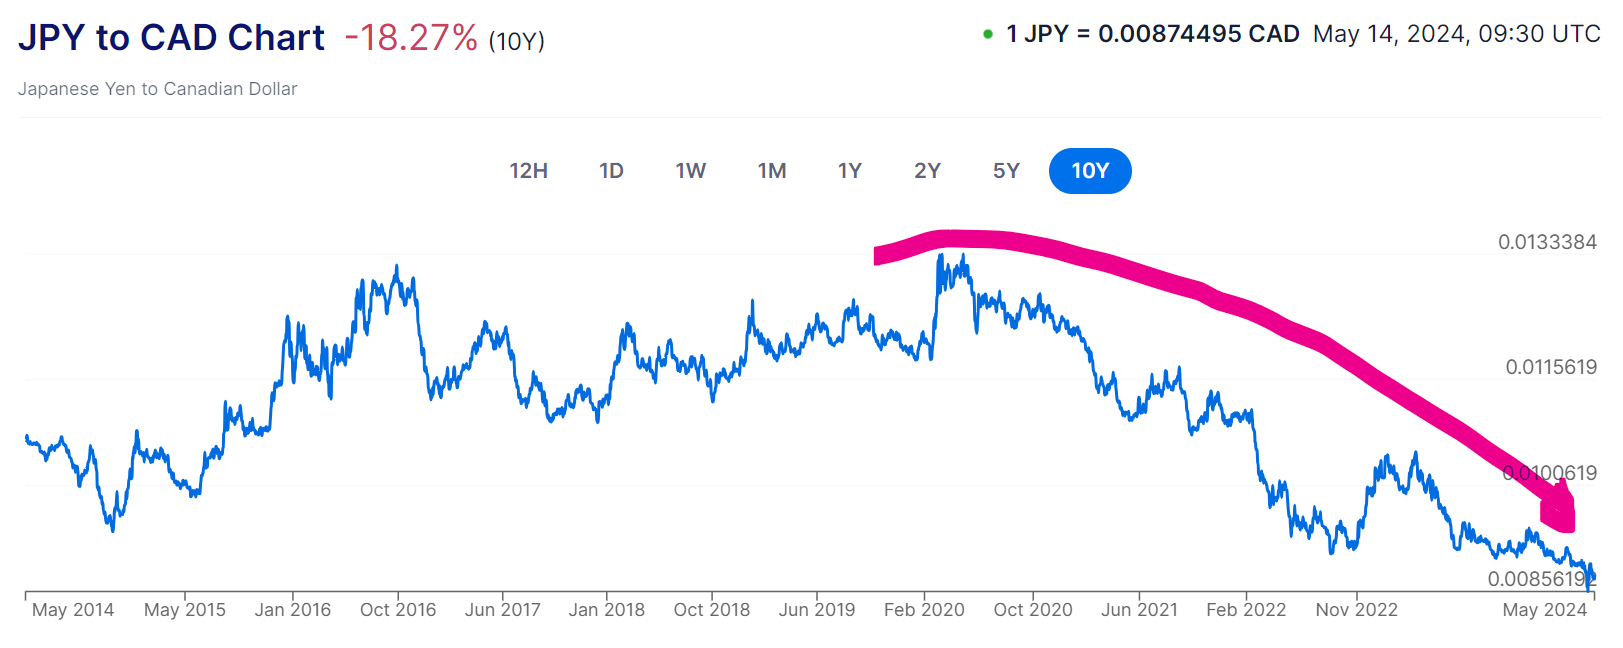
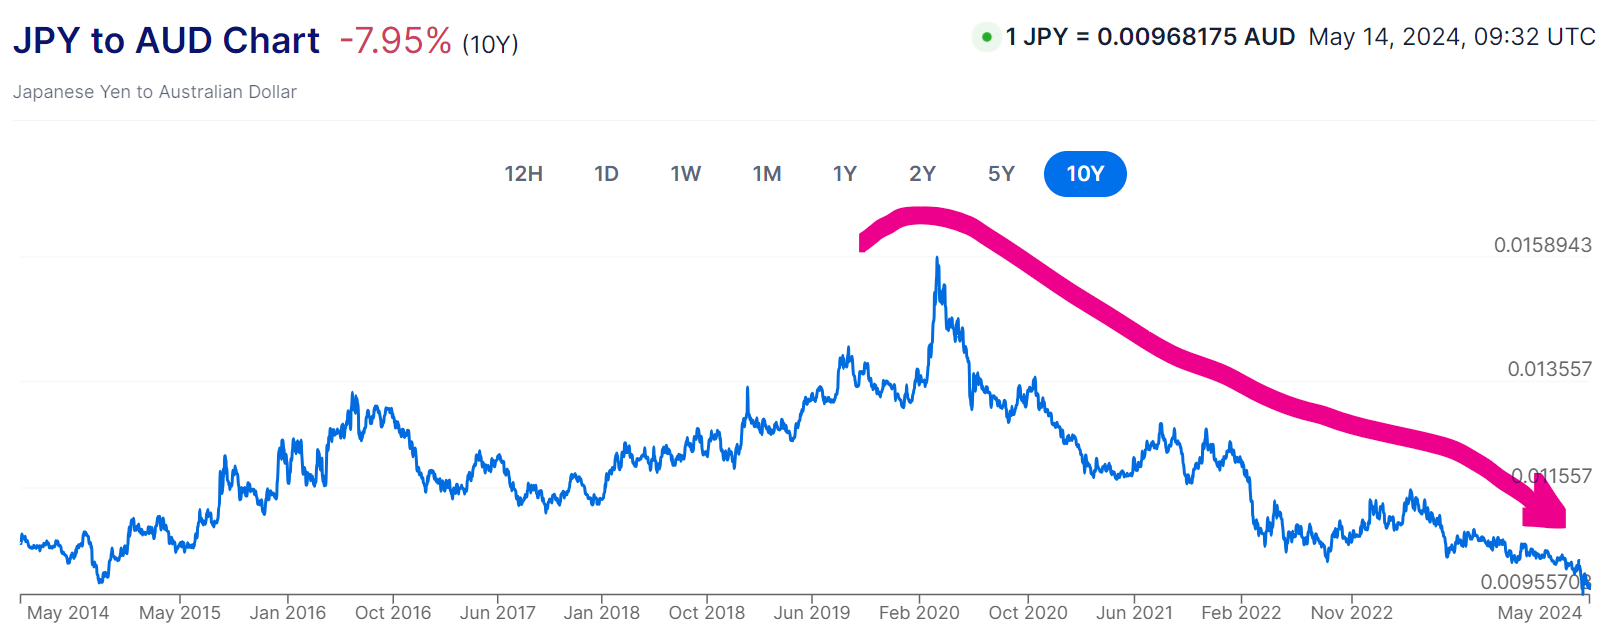
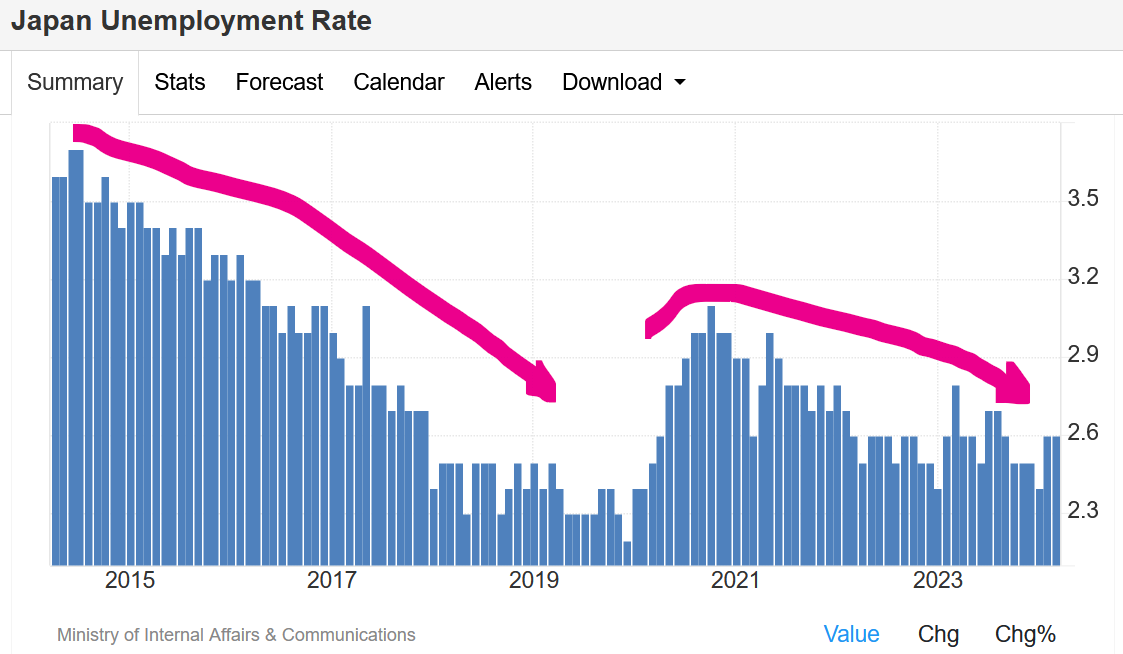
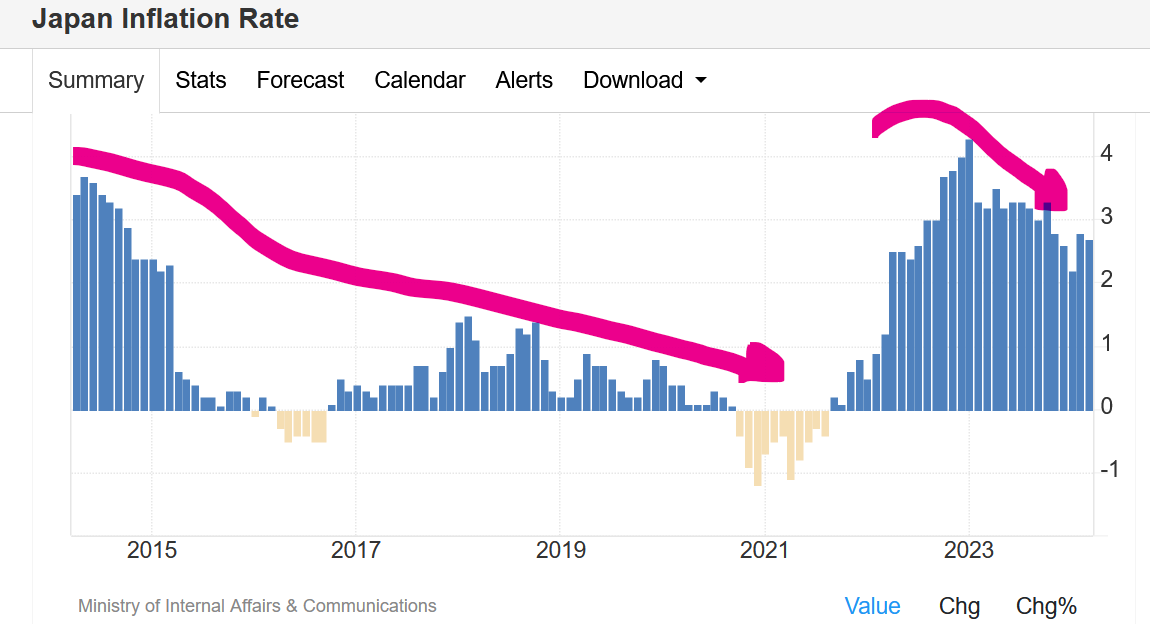
In such a situation, the currency exchange rate on international markets can be expected to fall as demand volume for Yen falls. These charts show the last 10 years of Yen exchange rates to major currencies, unemployment rates, CPI inflation rates. These declines are all in anticipation of the de-growth to come.
Versus US Dollar
Versus Euro
Versus British Pound
Versus Canadian Dollar
Versus Australian Dollar
UNEMPLOYMENT — falling again after the Covid Panic-Demic of 2020/2021
CPI Inflation — a sharp, rebound rise after the Covid Panic-Demic but it has resumed falling yet again
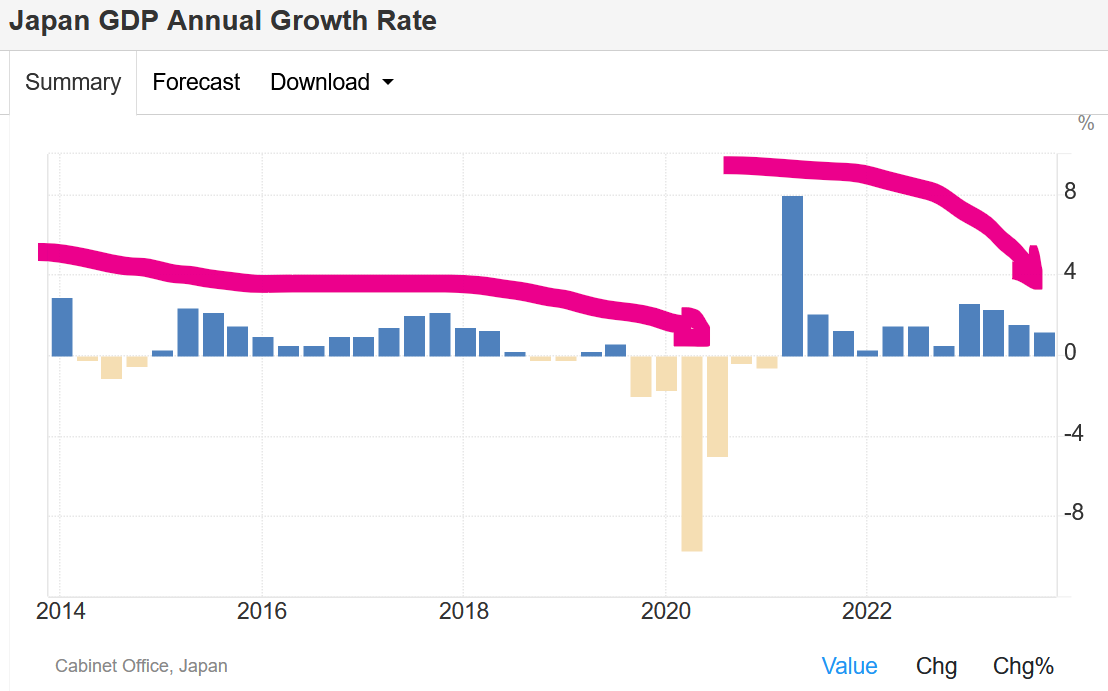
ANNUAL GDP GROWTH RATE — falling towards Zero
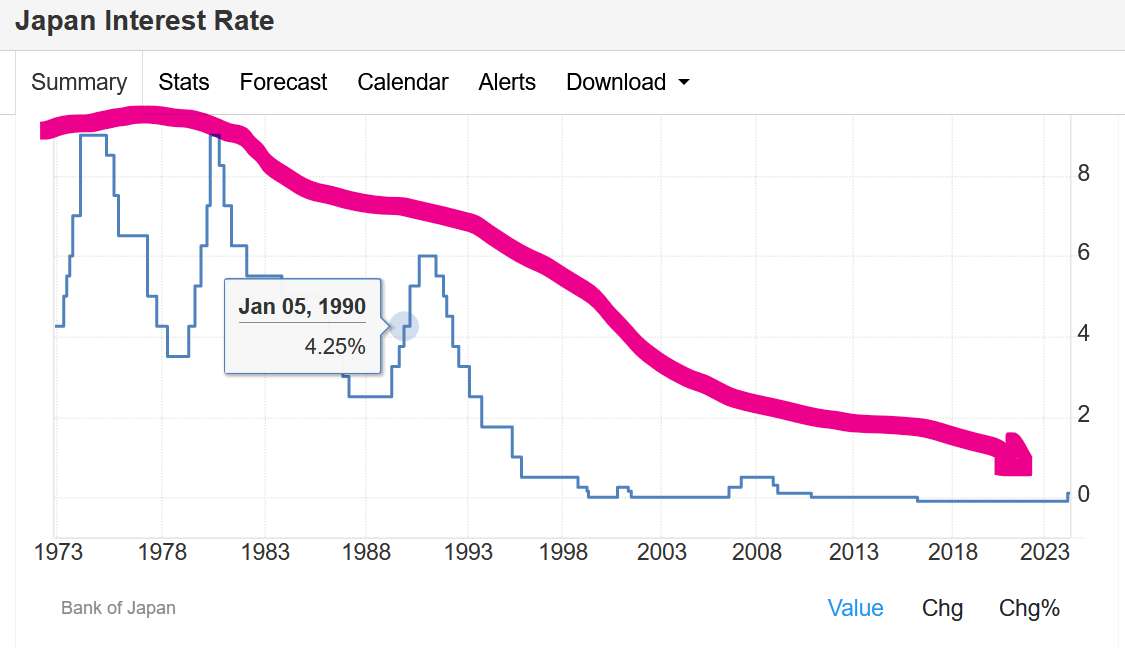
Official Interest Rate — since 1973
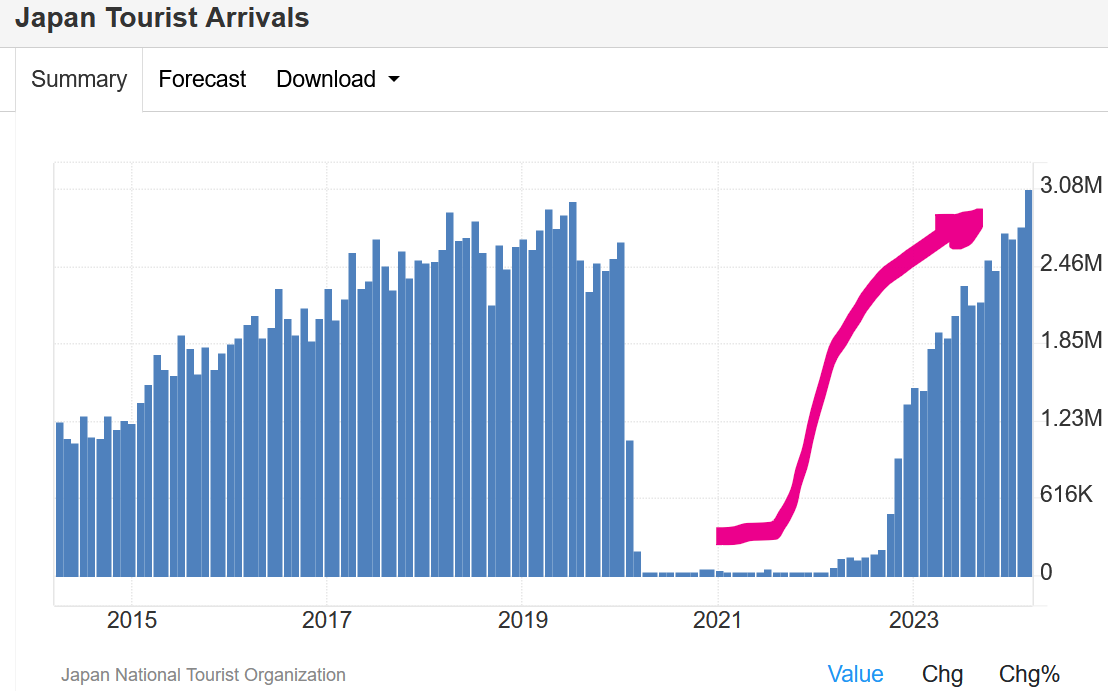
Tourist Arrivals are BOOMING
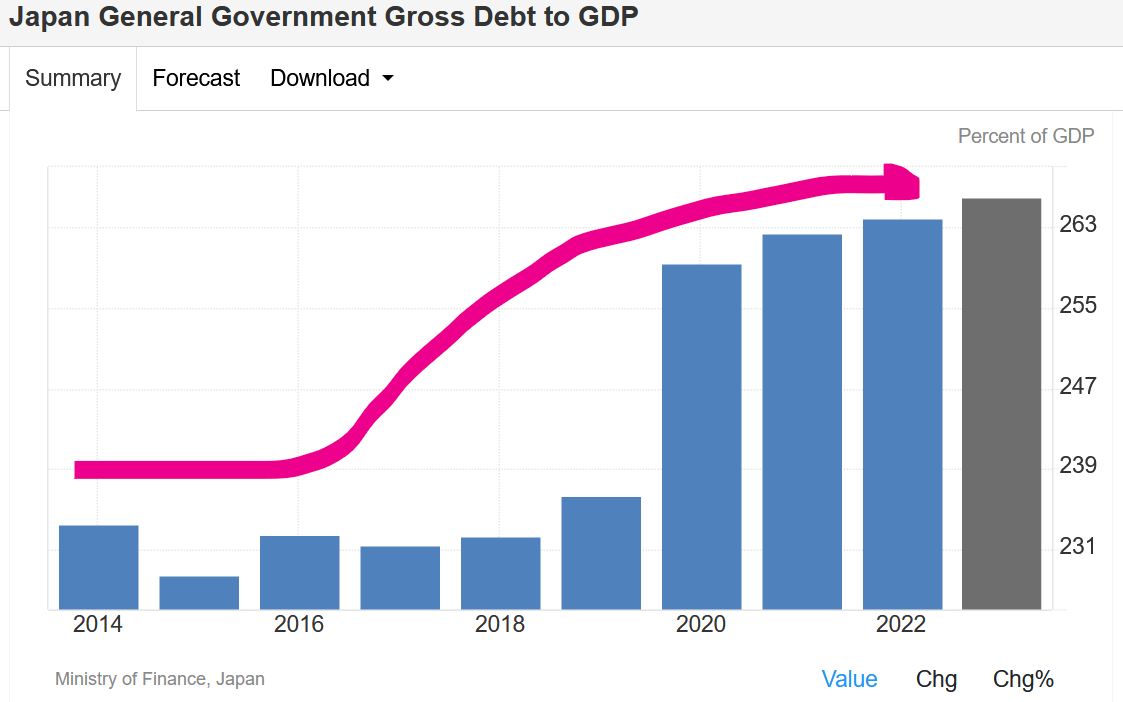
Government Debt to GDP Ratio — WORLD CHAMPION — 264 % (!!)
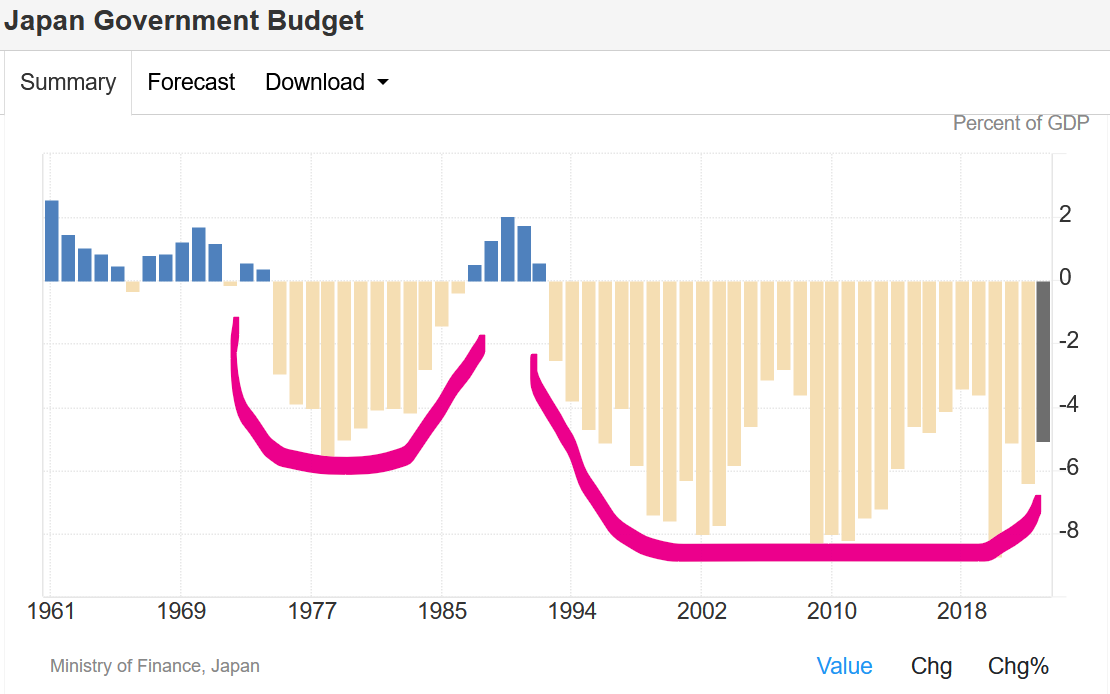
Government Budget (over 65 Years) — Persistent Budget Deficits
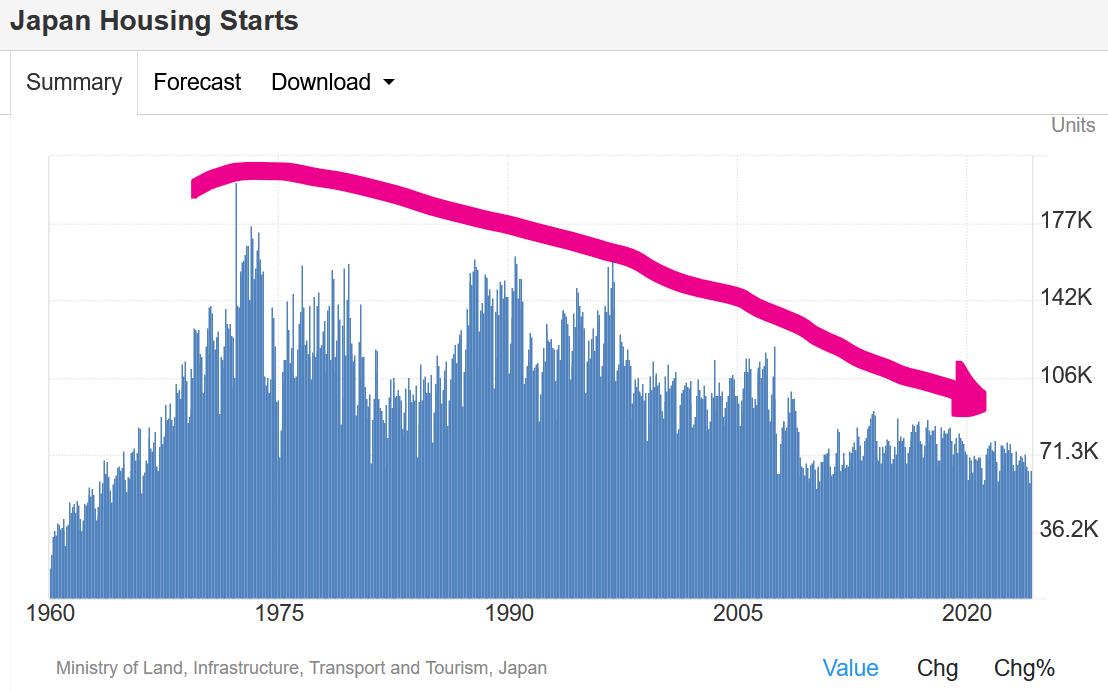
Housing Starts since 1960
JAPANESE STOCK MARKET PERFORMANCE SINCE 1970
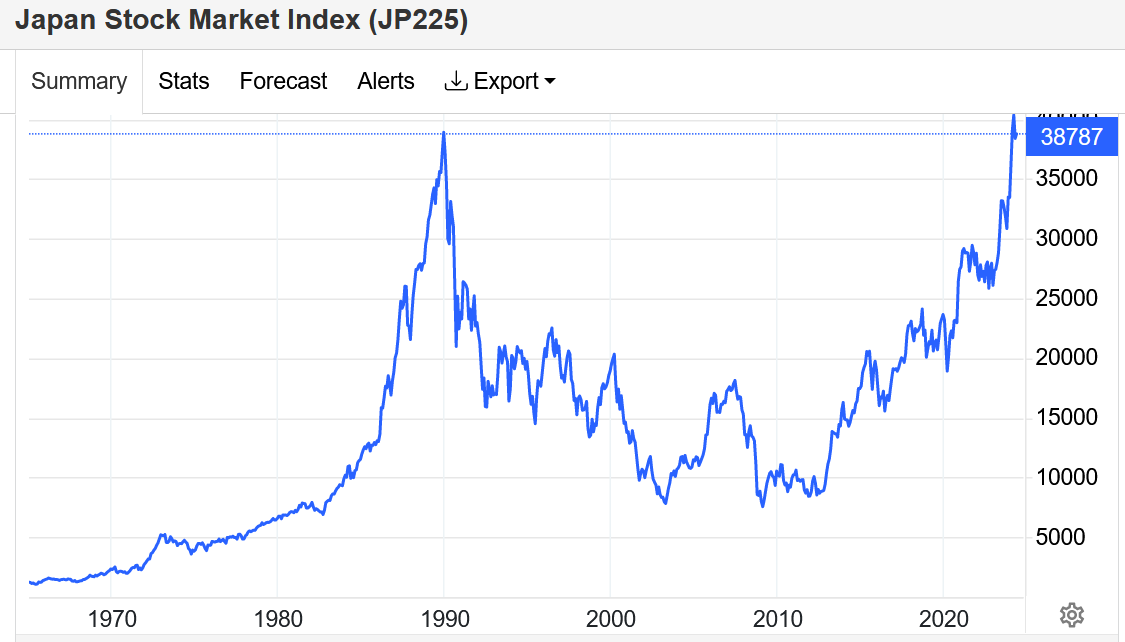
De-Growth is reality now in Japan. The process cannot be stopped. So far, the people appear to be benefiting from it. Their standard of living is high with abundant food, goods and services being readily available and employment levels are high. Is this the future for all advanced economies?
BANKING PROFITS
Considering the contraction in population numbers, it is logical to expect falling GDP, low unemployment and low CPI inflation to continue in Japan. BOOM is expecting that credit expansion will eventually not respond to low interest rates and then the profitability of Japanese commercial banks should start to fall. However, that is not evident yet. Japanese banks are still in the Top 10 based upon total profits and profits per person.
Banking profits can be analysed many ways. However, let’s look at banking profits in the Top 10 Nations and then let’s compare those profits on a population basis — Japan is in the middle of the pack.
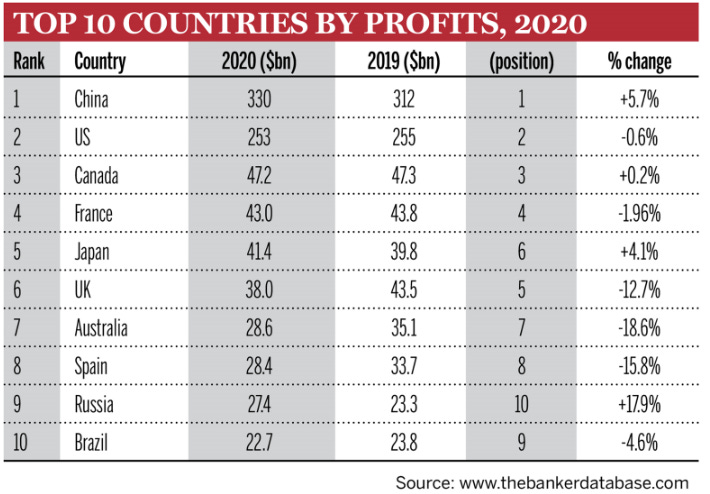
Bank Profits (Yr 2020) on a Population basis (UN Estimate 2022) (USD) —
China US $ 330 Billion/1.4 Billion pop. = $ 235 per person
United States $ 253 Billion/340 Million pop. = $ 744 (pp)
Canada $ 47.2 Billion/38.4 Million pop. = $ 1,230 (pp)
France $ 43 Billion/64 Million pop. = $ 671 per person (pp)
Japan $ 41.4 Billion/124 Million pop. = $ 333 (pp)
United Kingdom $ 38 Billion/67.5 Million pop. = $ 562 (pp)
Australia $ 28.6 Billion/26 Million pop. = $ 1,100 (pp)
Spain $ 28.4 Billion/47.5 Million = $ 597 (pp)
Russia $ 27.4 Billion/144 Million = $ 190 (pp)
Brazil $ 22.7 Billion/215 Million = $ 105 (pp)
Thus, the most profitable commercial banks in the world are in the following order based upon a per capita basis —
Canada $ 1,230 per person (pp)
Australia $ 1,100 (pp)
United States $ 744 (pp)
France $ 671 (pp)
Spain $ 597 (pp)
United Kingdom $ 562 (pp)
Japan $ 333 (pp)
China $ 235 (pp)
Russia $ 190 (pp)
Brazil $ 105 (pp)
And we can also compare Bank Profits per capita on a Total Nominal GDP basis (2022 World Bank estimate) — the list then becomes a comparison of ratios.
Australia — $ 1,100/$ 1.675 Trillion = 656
Canada — $ 1,230/$ 2.14 Trillion = 574
Spain — $ 597/$1.4 Trillion = 426
France — $ 671/$ 2.78 Trillion = 241
United Kingdom — $ 562/$ 3 Trillion = 187
Russia — $ 190/$ 2.24 Trillion = 84
Japan — $ 333/$ 4.23 Trillion = 78
Brazil — $ 105/$ 1.9 Trillion = 55
United States $ 744/$ 25.4 Trillion = 29
China — $ 235/$ 18 Trillion = 13
Australian Bank profits per capita and per each Dollar of GDP rise to the top of the list. China falls to the bottom. Japan holds its position at Number 7 above Brazil, United States and China. The US falls dramatically from 3rd position to second last. China is last which is exactly what you would expect from a communist nation which runs a Potemkin Village of commercial banks.
BANK PROFITS AS A PERCENTAGE OF TOTAL GDP
Another way of thinking about Banking profits is to consider the total Bank Profits as a percentage of Annual National Nominal GDP (the total value of goods produced and services provided in a country during one year).
For example, Banking Profits as a percentage of Annual GDP — this time, Japan falls to the bottom of the pack. Perhaps this is a sign of weakness for the future?
In Canada, it is 2.2 %
In Spain, it is 2.02 %
In China, it is 1.8 %
In Australia, it is 1.7 %
In France, it is 1.54 %
In the UK, it is 1.266 %
In Russia, it is 1.2 %
In Brazil, it is 1.2 %
In the USA, it is about 1 %
In Japan, it is 0.98 %
PRE-PROGRAMMING THE BRAIN WORKS — YOU CAN BE CONTROLLED — EASILY
Watch as this young man is so easily hoodwinked …..
IS THIS CORRUPTION REVEALED? — THOUSANDS OF MEDIA DOCTORS PAID BY THE BIG PHARMA COVID VACCINE COMPANIES
Watch how these “independent” doctors provide their advice ….. to the TV viewers in the UK.
350 Comments — Here is just one —
“These are monsters. So many of them in the “public service”. These greedy freaks have destroyed all confidence in the medical “industry”. Horrifying.”
In economics, things work until they don’t. Until next week, make your own conclusions, do your own research. BOOM does not offer investment advice.
BOOM — ALL PREVIOUS EDITORIALS AVAILABLE AT BOOM ON WORDPRESS
https://boomfinanceandeconomics.wordpress.com/
Disclaimer: All content is presented for educational and/or entertainment purposes only. Under no circumstances should it be mistaken for professional investment advice, nor is it at all intended to be taken as such. The commentary and other contents simply reflect the opinion of the authors alone on the current and future status of the markets and various economies. It is subject to error and change without notice. The presence of a link to a website does not indicate approval or endorsement of that web site or any services, products, or opinions that may be offered by them.
Neither the information nor any opinion expressed constitutes a solicitation to buy or sell any securities nor investments. Do NOT ever purchase any security or investment without doing your own and sufficient research. Neither BOOM Finance and Economics.com nor any of its principals or contributors are under any obligation to update or keep current the information contained herein. The principals and related parties may at times have positions in the securities or investments referred to and may make purchases or sales of these securities and investments while this site is live. The analysis contained is based on both technical and fundamental research.
Although the information contained is derived from sources which are believed to be reliable, they cannot be guaranteed.
Disclosure: We accept no advertising or compensation, and have no material connection to any products, brands, topics or companies mentioned anywhere on the site.
Fair Use Notice: This site contains copyrighted material the use of which has not always been specifically authorized by the copyright owner. We are making such material available in our efforts to advance understanding of issues of economic and social significance. We believe this constitutes a ‘fair use’ of any such copyrighted material as provided for in section 107 of the US Copyright Law. In accordance with Title 17 U.S.C. Section 107, the material on this site is distributed without profit. If you wish to use copyrighted material from this site for purposes of your own that go beyond ‘fair use’, you must obtain permission from the copyright owner.
Subscribe to BOOM Finance and Economics on Substack
By Dr Gerry Brady
BOOM has developed a loyal readership over 5 years on other platforms which includes many of the world’s most senior economists, central bankers, fund managers and academics.
